OVERVIEW OF PROJECT MANAGEMENT
Whether you are developing an information system or working on a construction project, the process is the same. The only difference is the nature of the project. Project management for IT professionals includes planning, scheduling, monitoring and controlling, and reporting on information system development.
What Shapes a Project?
A successful project must be completed on time, within budget, and deliver a quality product that satisfies users and meets requirements. Project management techniques can be used throughout the SDLC. System developers can initiate a formal project as early as the preliminary investigation stage, or later on, as analysis, design, and implementation activities occur. Sometimes you have to decide what is most important. The same concept applies to systems development, where the factors include budget limits, time constraints, and quality standards. As long as everything is in balance, the project will be successful. However, if one factor changes, adjustments must be made. Because the factors interact constantly, a project manager must respond quickly. For example, if an extremely time-critical project starts to slip, the project manager might have to trim some features, seek approval for a budget increase, simplify the testing plan, or a combination of all three actions. Unfortunately, many systems projects do fail. A report by The Standish Group noted that only a third of all software development projects were successful, in the sense that they met budget, schedule, and quality targets. Standish chairman Jim Johnson said that improvement will require better project management tools, more iterative methods, and better communication between project developers and users.

What Does a Project Manager Do?
Whether a project involves a new office building or an information system, good leadership is essential. In a systems project, the project manager, or project leader, usually is a senior systems analyst or an IT department manager if the project is large. An analyst or a programmer/analyst might manage smaller projects. In addition to the project manager, most large projects have a project coordinator. A project coordinator handles administrative responsibilities for the team and negotiates with users who might have conflicting requirements or want changes that would require additional time or expense. Project managers typically perform four activities, or functions: planning, scheduling, monitoring, and reporting.
• Project planning includes identifying all project tasks and estimating the completion time and cost of each.
• Project scheduling involves the creation of a specific timetable, usually in the form of charts that show tasks, task dependencies, and critical tasks that might delay the project. Scheduling also involves selecting and staffing the project team and assigning specific tasks to team members. Project scheduling uses Gantt charts and PERT/CPM charts.
• Project monitoring requires guiding, supervising, and coordinating the project team’s workload. The project manager must monitor the progress, evaluate the results, and take corrective action when necessary to control the project and stay on target.
• Project reporting includes regular progress reports to management, users, and the project team itself. Effective reporting requires strong communication skills and a sense of what others want and need to know about the project.
Project Activities and Planning Steps
On any given day, a project manager might perform one or more of the activities listed above. However, as Figure 3-5 suggests, each activity is part of a larger framework, which includes three key steps in project planning:
• Create a work breakdown structure.
• Identify task patterns.
• Calculate the critical path.
The matrix in Figure 3-5 on the next page shows typical activities that the project leader performs as the project develops. When the project becomes operational, he or she also manages the people, the schedule, the budget, and the progress.
STEP 1: CREATE A WORK BREAKDOWN STRUCTURE
A work breakdown structure (WBS) involves breaking a project down into a series of smaller tasks. Before creating work breakdown structures, you should understand the two primary chart types: Gantt charts and PERT/CPM charts.
What Is a Gantt Chart?
Gantt charts were developed almost 100 years ago by Henry L. Gantt, a mechanical engineer and management consultant. His goal was to design a chart that could show planned and actual progress on a project. A Gantt chart is a horizontal bar chart that represents a set of tasks. For example, the Gantt chart in Figure 3-6 displays five tasks in a vertical array, with time shown on the horizontal axis. The position of the bar shows the planned starting and ending time of each task, and the length of the bar indicates its duration. On the horizontal axis, time can be shown as elapsed time from a fixed starting point, or as actual calendar dates. A Gantt chart also can simplify a complex project by combining several activities into a task group. For example, in Figure 3-6, Task 4 might consist of five separate tasks, which are hidden in this view.

A Gantt chart can show task status by adding a contrasting color to the horizontal bars. For example, a vertical arrow marks the current date in Figure 3-6. With a fixed reference point, it is easy to see that Task 1 is way behind schedule, Task 2 is only about 80 percent done and is running behind schedule, Task 3 should have started, but no work has been done, Task 4 actually is running ahead of schedule, and Task 5 will begin in several weeks. Gantt charts can present an overview of the project’s status, but they do not provide enough detailed information, which is necessary when managing a complex project. Most project managers find that PERT/CPM charts, which are discussed in the following section, are better tools for managing large projects.
What Is a PERT/CPM Chart?
The Program Evaluation Review Technique (PERT) was developed by the U.S. Navy to manage very complex projects, such as the construction of nuclear submarines. At approximately the same time, the Critical Path Method (CPM) was developed by private
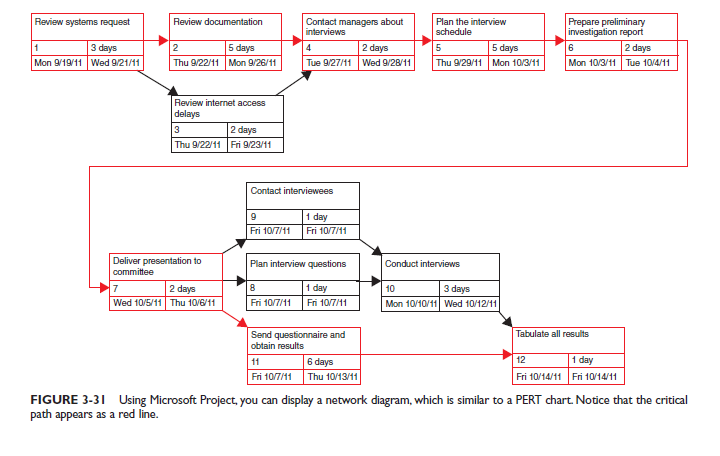
industry to meet similar project management needs. The distinction between the two methods has disappeared over time, and today the technique is called either PERT, CPM, or PERT/CPM. PERT is a bottom-up technique, because it analyzes a large, complex project as a series of individual tasks. To create a PERT chart, you first identify all the project tasks and estimate how much time each task will take to perform. Next, you must determine the logical order in which the tasks must be performed. For example, some tasks cannot start until other tasks have been completed. In other situations, several tasks can be performed at the same time. Once you know the tasks, their durations, and the order in which they must be performed, you can calculate the time that it will take to complete the project. You also can identify the specific tasks that will be critical to the project’s on-time completion. An example of a PERT chart, which Microsoft calls a network diagram, is shown in Figure 3-7.

Which Type of Chart Is Better?
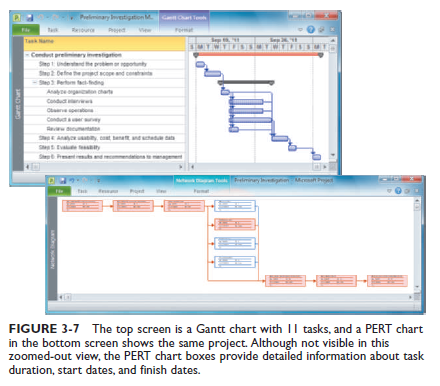
Although a Gantt chart offers a valuable snapshot view of the project, PERT charts are more useful for scheduling, monitoring, and controlling the actual work. With a PERT chart, a project manager can convert task start and finish times to actual dates by laying out the entire project on a calendar. Then, on any given day, the manager can compare what should be happening with what is taking place, and react accordingly. Also, a PERT chart displays complex task patterns and relationships. This information is valuable to a manager who is trying to address high priority issues. PERT and Gantt charts are not mutually exclusive techniques, and project managers often use both methods. Figure 3-7 shows both chart types. The top screen is a Gantt chart with 11 tasks. The PERT chart in the bottom screen shows the same project, using a separate box for each task instead of a horizontal bar. Although they both show the task patterns and flow, the PERT chart boxes can provide more detailed information, such as task duration, start date, and finish date.
Identifying Tasks in a Work Breakdown Structure
A work breakdown structure must clearly identify each task and include an estimated duration. A task, or activity, is any work that has a beginning and an end and requires the use of company resources such as people, time, or money. Examples of tasks include conducting interviews, designing a report, selecting software, waiting for the delivery of equipment, or training users. Tasks are basic units of work that the project manager plans, schedules, and monitors — so they should be relatively small and manageable. In addition to tasks, every project has events, or milestones. An event, or milestone, is a recognizable reference point that you can use to monitor progress. For example, an event might be the start of user training, the conversion of system data, or the completion of interviews. A milestone such as Complete 50 percent of program testing would not be useful information unless you could determine exactly when that event will occur. Figure 3-8 shows tasks and events that might be involved in the creation, distribution, and tabulation of a questionnaire.

Notice that
the beginning and end of each task is marked by a recognizable event. If you tried to manage a project as one large task, it would be impossible. Instead, you break the project down into smaller tasks, creating a work breakdown structure (WBS).
The first step in creating a WBS is to list all the tasks.
LISTING THE TASKS
While this step sounds simple, it can be challenging, because the tasks might be embedded in a document, such as the one shown in the first version of Figure 3-9.
One trick is to start by highlighting the individual tasks, as shown in the second version. Adding bullets makes the tasks stand out more clearly, as shown in the third version. The next step is to number the tasks and create a table, similar to the one shown in Figure 3-10, with columns for task number, description, duration, and predecessor tasks.
ESTIMATING TASK DURATION
Task duration can be hours, days, or weeks — depending on the project. Because the following example uses days, the units of measurement are called person-days. A person-day represents the work that one person can complete in one day. This approach, however, can present some problems. For example, if it will take one person 20 days to perform a particular task, it might not be true that two people could complete the same task in 10 days or that 10 people could perform the task in two days. Some tasks can be divided evenly so it is possible to use different combinations of time and people, up to a point. For instance, if it takes two persondays to install the cables for a new local area network, one person might do the task in two days, two people in one day, or four people in half a day. In most systems analysis tasks, however, time and people are not interchangeable. If one analyst needs two hours to interview a user, two analysts also will need two hours to do the same interview.Project managers often use a weighted formula for estimating the duration of each task. The project manager first makes three time estimates for each task: an optimistic, or best-case estimate (B), a probable-case estimate (P), and a pessimistic, or worst-case estimate (W). The manager then assigns a weight, which is an importance value, to each estimate. The weight can vary, but a common approach is to use a ratio of B = 1, P = 4, and W = 1. The expected task duration is calculated as follows:

For example, a project manager might estimate that a file-conversion task could be completed in as few as 20 days or could take as many as 34 days, but most likely will require 24 days. Using the formula, the expected task duration is 25 days, calculated as follows:
Factors Affecting Duration
When developing duration estimates, project managers consider four factors:
• Project size
• Human resources
• Experience with similar projects
• Constraints
PROJECT SIZE
You have learned in that information systems have various characteristics that affect their complexity and cost. In addition to considering those factors, a project manager must estimate the time required to complete each project phase. To develop accurate estimates, a project manager must identify all project tasks, from initial fact-finding to system implementation. Regardless of the systems development methodology used, the project manager must determine how much time will be needed to perform each task. In developing an estimate, the project manager must allow time for meetings, project reviews, training, and any other factors that could affect the productivity of the development team.
HUMAN RESOURCES
Companies must invest heavily in cutting-edge technology and Web-based systems to remain competitive in a connected world. In many areas, skilled IT professionals are in great demand, and firms must work hard to attract and retain the talent they need. A project manager must assemble and guide a development team that has the skill and experience to handle the project. If necessary, additional systems analysts or programmers must be hired or trained, and this must be accomplished within a specific time frame. After a project gets under way, the project manager must deal with turnover, job vacancies, and escalating salaries in the technology sector — all of which can affect whether the project can be completed on time and within budget.
EXPERIENCE WITH SIMILAR PROJECTS
A project manager can develop time and cost estimates based on the resources used for similar, previously developed information systems. The experience method works best for small- or medium-sized projects where the two systems are similar in size, basic content, and operating environment. In large systems with more variables, the estimates are less reliable. In addition, you might not be able to use experience from projects that were developed in a different environment. For example, when you use a new Web-based database application, you might not have previous experience to measure in this environment. In this situation, you could design a prototype or pilot system to gain technical and cost estimating experience.
CONSTRAINTS
You have learned that constraints are defined during the preliminary investigation. A constraint is a condition, restriction, or requirement that the system must satisfy. For example, a constraint might involve maximums for one or more resources, such as time, dollars, or people. A project manager must define system requirements that can be achieved realistically within the required constraints. In the absence of constraints, the project manager simply calculates the resources needed. However, if constraints are present, the project manager must adjust other resources or change the scope of the project.
Displaying the Work Breakdown Structure
After you enter the task durations, the work breakdown structure will look like Figure 3-11. If you are managing a complex project with many tasks, you can use task groups, just as you would in a Gantt chart, to simplify the list. If you are using Microsoft Project, the WBS might resemble Figure 3-12.
STEP 2: IDENTIFY TASK PATTERNS
Tasks in a work breakdown structure must be arranged in a logical sequence called a task pattern. This section will show you how to understand and create graphical models of these patterns.
What Are Task Patterns?
In any project, large or small, tasks depend on each other and must be performed in a sequence, not unlike the commands in a software program. Task patterns can involve dependent tasks, multiple successor tasks, and multiple predecessor tasks. In larger projects, these patterns can be very complex, and an analyst must study the logical flow carefully.
How Do I Use Task Boxes to Create a Model?
In a PERT/CPM chart, project tasks are shown as rectangular boxes, arranged in the sequence in which they must be performed. Each rectangular box, called a task box, has
five sections, as shown in Figure 3-13. Each section of the task
box contains important information about the task, including the Task Name, Task ID, Task Duration, Start Day/Date, and Finish Day/Date.
TASK NAME The task name should be brief and descriptive, but it does not have to be unique in the project. For example, a task named Conduct Interviews might occur in several phases of the project. TASK ID The task ID can be a number or code that provides unique identification.
TASK DURATION The duration is the amount of time it will take to complete a task. All tasks must use the same time units, which can be hours, days, weeks, or months, depending on the project. An actual project starts on a specific date, but can also be measured from a point in time, such as Day 1.
START DAY/DATE The start day/date is the time that a task is scheduled to begin. For example, suppose that a simple project has two tasks: Task 1 and Task 2. Also suppose that Task 2 cannot begin until Task 1 is finished. An analogy might be that you cannot run a program until you turn on your computer. If Task 1 begins on Day 1 and has a duration of three days, it will finish on Day 3. Because Task 2 cannot begin until Task 1 is completed, the start time for Task 2 is Day 4, which is the day after Task 1 is finished.
FINISH DAY/DATE The finish day/date is the time that a task is scheduled to be completed. To calculate the finish day or date, you add the duration to the start day or date. When you do this, you must be very careful not to add too many days. For example, if a task starts on Day 10 and has a duration of 5 days, then the finish would be on Day 14 — not Day 15.
What Are the Main Types of Task Patterns?
A project is based on a pattern of tasks. In a large project the overall pattern would be quite complex, but it can be broken down into three basic patterns: dependent tasks, multiple successor tasks, and multiple predecessor tasks.
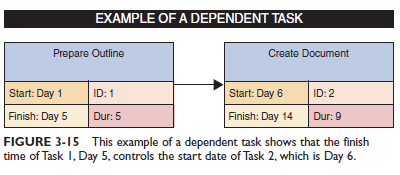
DEPENDENT TASKS When tasks must be completed one after another, like the relay
 race, they are called dependent tasks, because one depends on the other. For example, Figure 3-15 shows that Task 2 depends on Task 1, because Task 2 cannot start until Task 1 is completed. In this example, the finish time of Task 1, Day 5, controls the start date of Task 2, which is Day 6.
MULTIPLE SUCCESSOR TASKS When several
tasks can start at the same time, each is
called a concurrent task. Often, two or more concurrent tasks depend on a single prior task, which is called a predecessor task. In this situation, each concurrent task is called a successor task. In the example shown in Figure 3-16, successor Tasks 2 and 3 both can begin as soon as Task 1 is finished. Notice that the finish time for Task 1 determines the start time for both Tasks 2 and 3. In other words, the earliest that Task 1 can finish is day 30, so day 31 is the earliest that Tasks 2 and 3 can start.
MULTIPLE PREDECESSOR TASKS Suppose
that a task requires two or more prior tasks to be completed before it can start. Figure 3-17 on the next page shows that example, because Task 3 cannot begin until Tasks 1 and 2 are both completed. Since the two tasks might not finish at the same time, the longest (latest) predecessor task becomes the controlling factor. Notice that the start for Task 3 is Day 16, not Day 6. Why is this so? Because Task 3 depends on two predecessor tasks, Tasks 1 and 2, Task 3 cannot begin until the later of those tasks is complete. Therefore, the start time for a successor task must be the latest (largest) finish time for any of its preceding tasks. In the example shown, Task 1 ends on Day 15, while Task 2 ends on Day 5, so Task 1 controls the start time for Task 3.
How Do I Identify Task Patterns?
You can identify task patterns by looking carefully at the wording of the task statement. Words like then, when, or and are action words that signal a sequence of events. Here are three simple examples:
• Do Task 1, then do Task 2 describes dependent tasks that must be completed one after the other.
• When Task 2 is finished, start two tasks: Task 3 and Task 4 describes multiple successor tasks that can both start as soon as Task 2 is finished.
• When Tasks 5 and 6 are done, start Task 7 indicates that Task 7 is a multiple predecessor task because it can’t start until two or more previous tasks all are completed.
How Do I Work With Complex Task Patterns?
When several task patterns combine, you must study the facts very carefully to understand the logic and sequence. A
project schedule will not be accurate if the underlying task pattern is incorrect. For example, consider the following
three fact statements and the task patterns they represent. Examples of the task patterns are shown Figures 3-18, 3-19, and 3-20.
DEPENDENT TASKS Perform Task 1. When Task 1 is complete, perform Task 2.
DEPENDENT TASKS AND MULTIPLE SUCCESSOR TASKS Perform Task 1. When Task 1 is complete, perform Task 2. When Task 2 is finished, start two tasks: Task 3 and Task 4. When Task 3 is complete, start two more tasks: Task 5 and Task 6.
DEPENDENT TASKS, MULTIPLE SUCCESSOR TASKS, AND MULTIPLE PREDECESSOR TASKS Perform Task 1. When Task 1 is complete, perform Task 2. When Task 2 is finished, start two Tasks: Task 3 and Task 4. When Task 3 is complete, start two more tasks: Task 5 and Task 6. When Tasks 5 and 6 are done, start Task 7. Then, when Tasks 4 and 7 are finished, perform Task 8.
STEP 3: CALCULATE THE CRITICAL PATH
Task patterns determine the order in which the tasks are performed. Once the task sequence has been defined, a project manager can schedule the tasks and calculate the critical path.
What Is a Critical Path?
A critical path is a series of tasks which, if delayed, would affect the completion date of the overall project. If any task on the critical path falls behind schedule, the entire project will be delayed. For example, suppose that you invite Joan and Jim to your home for dinner. Joan arrives on time, but Jim arrives 30 minutes late. Jim’s arrival is part of the critical path, because you do not want to start without him, so the meal will be served 30 minutes later than originally planned. Project managers always must be aware of the critical path, so they can respond quickly to keep the project on track. Microsoft Project and other project management software can highlight the series of tasks that form the critical path.
How Do I Calculate the Critical Path?
Figure 3-21 shows a training project with five tasks. Notice that the analyst has arranged the tasks and entered task names, IDs, and duration. First, you should review the task patterns. In this example, Task 1 is followed by Task 2, which is a dependent task. Task 2 has two successor tasks: Task 3 and Task 4. Tasks 3 and 4 are predecessor tasks for Task 5. The next step is to determine start and finish dates, which will determine the critical path for the project. The following explanation will guide you through a step-by-step process. The result is shown in Figure 3-22.
• Task 1 starts on Day 1 and has a duration of 10 days, so the finish date is Day 10.
• Task 2, which is dependent on Task 1, can start on Day 11 — the day after Task 1 ends. With a duration of 30 days, Task 2 will end on Day 40.
• Tasks 3 and 4 are multiple successor tasks that can start after Task 2 is done. Task 2 ends on Day 40, so Tasks 3 and 4 both can start on Day 41. Task 3 has a duration of 5 days, and will end on Day 45. Task 4 has a duration of 25 days, and will not end until Day 65.
• Task 5 depends on Tasks 3 and 4, which are multiple predecessors. Because Task 5 depends on both tasks, it cannot start until the later of the two tasks is complete. In this example, Task 3 ends earlier, but Task 4 will not be completed until Day 65, so Task 5 cannot start until Day 66. Recall that the critical path is a series of tasks which, if delayed, would affect the final completion date of the overall project. In this example, Tasks 1 and 2 are the first tasks on the critical path. Now look at Task 5, which cannot start until both Tasks 3 and 4 are done. In this case, Task 4 is the controlling factor, because Task 4 finishes on Day 65, which is 20 days later than Task 3, which is completed on Day 45.
Therefore, the start date for Task 5 is determined by the finish date for Task 4. In contrast, Task 3 has slack time, and could be delayed up to 20 days without affecting Task 5. Slack time is the amount of time that the task could be late without pushing back the completion date of the entire project. Tasks 1, 2, 4, and 5 represent the critical path, which is highlighted with red arrows in Figure 3-22.