PERT/CPM Example

Figure 3-25 shows a list of 11 tasks. The example is more complex, but the same guidelines apply. Notice that each task has an ID, a description, a duration, and a reference to predecessor tasks, if any, which must be completed before the task can begin. Also notice that dependent tasks can have one predecessor task, or several. You construct a PERT/CPM chart from this task list in a two-step process:
STEP 1: CREATE THE WORK BREAKDOWN STRUCTURE
In the first step, as shown in Figure 3-26 , you identify the tasks, determine task

STEP 2: ENTER START AND FINISH TIMES
In the second step, as shown in Figure 3-27, you enter the start and finish times by applying the guidelines in this section. For example, Task 1 has a one-day duration, so you enter the start and finish times for Task 1 as Day 1. Then you enter Day 2 as the start time for successor Tasks 2 and 3. Continuing from left to right, you add the task duration for each task to its start time to determine its finish time. As you proceed, there are three important rules you must keep in mind:
• If a successor task has more than one predecessor task, use the latest finish time of the predecessor tasks to determine the start time for the successor task.
• If a predecessor task has more than one successor task, use the predecessor task’s finish time to determine the start time for all successor tasks.
• Continuing from left to right, add the task duration for each task to its start time to determine and enter its finish time. Again, be very careful not to add too many days. For example, if a task starts on Day 10 and has a duration of 5 days, then the finish would be Day 14 — not Day 15. When you enter all the start and finish times, you determine that the project will be completed on Day 155. Also, you note that Tasks 1, 2, 4, 6, 9, and 11 represent the critical path shown by the red arrows.

Software-Driven Example
Project managers use powerful software to help plan, schedule, monitor, and report on a project. Most project management programs offer features such as PERT/CPM, Gantt charts, resource scheduling, project calendars, and cost tracking. Microsoft Project is a full-featured project management program that holds the dominant share of the market. On the Web, Microsoft offers demo versions, training, and tips. Although Microsoft is the industry leader, many other vendors offer project management software, and you can explore these options by searching on the Web. One product, Open Workbench, is available as free software, complete with manuals and sample projects, as shown in Figure 3-28.

WORK BREAKDOWN STRUCTURE

You already know how to create a work breakdown structure. If you are using Microsoft Project or Open Workbench, the process is exactly the same. You must identify the tasks, durations, and task patterns. You might have to develop this information on your own, or you might work with a task summary like the one in Figure 3-29. Your manager would like you to create a Gantt chart and a PERT chart that show all tasks, dependencies, dates, and total project duration. Your first step is to create a Gantt chart showing the necessary information. You decide to use Microsoft Project to construct the chart. As you enter each task, you also enter the duration and the predecessor tasks, if any.
GANTT CHART
As you enter the tasks, durations, and predecessor tasks, the program automatically performs the calculations, detects the task patterns, and creates a Gantt chart similar to the one shown in Figure 3-30. The chart consists of 12 horizontal bars, connected with arrows that indicate the task dependencies. Notice that Saturdays and Sundays are shown as shaded columns, because no work will be performed on those days. The program makes these adjustments automatically. For example, Task 2, which has a duration of three days, starts on Thursday and ends on Monday.

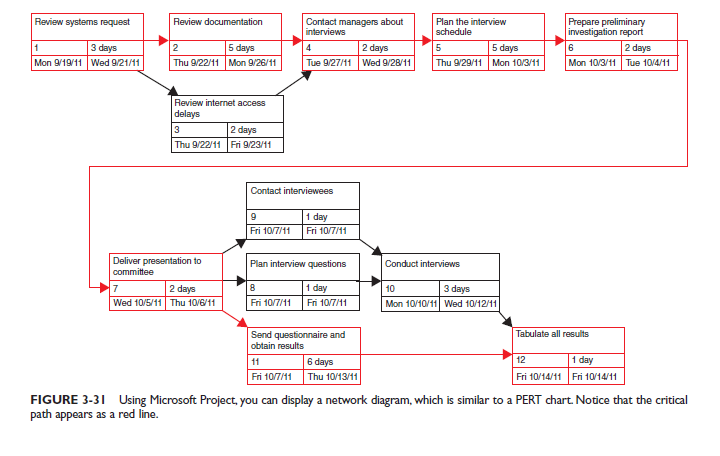
NETWORK DIAGRAM
After you complete the Gantt chart, you decide to view the data in the form of a Microsoft Project network diagram, which is similar to a PERT chart. When you select the Network Diagram option on the View menu, you can see the project tasks and dependencies, as shown in Figure 3-31.

Did you realize there's a 12 word sentence you can say to your man... that will trigger deep emotions of love and instinctual attraction to you deep inside his chest?
ReplyDeleteThat's because hidden in these 12 words is a "secret signal" that fuels a man's impulse to love, admire and protect you with his entire heart...
12 Words That Fuel A Man's Love Response
This impulse is so hardwired into a man's brain that it will make him work harder than before to build your relationship stronger.
Matter-of-fact, triggering this all-powerful impulse is so binding to achieving the best possible relationship with your man that the second you send your man a "Secret Signal"...
...You'll instantly notice him expose his heart and soul to you in a way he haven't expressed before and he'll recognize you as the one and only woman in the galaxy who has ever truly understood him.
Really enjoyed these clear project management examples and how they break down complex concepts like PERT/CPM and Gantt charts — great resource that pairs well with exploring the Best Ms Project Training Perth .
ReplyDeleteThe two-step explanation from WBS to network logic is practical for teams that struggle with sequencing quality. I have found that schedule confidence improves only when decomposition and dependency mapping are handled together. At Plexo (https://plexo.work), AI Task Breakdown helps prepare that structure before teams move into detailed scheduling. What is your preferred way to validate dependency quality before baseline approval?
ReplyDelete